Company
DE
Platform
Web
Role
Product Designer
Timeline
March 2025

Historical Context
DE, a leading solar energy consultaning company, faced challenges with its outdated project management system. The system was difficult to navigate, lacked essential features, and did not meet the needs of its diverse user base. To address these issues, we conducted user research and redesigned the system to improve usability, enhance functionality, and streamline operations.


Key Problems
User Persona
User personas of 3 types of users who would be using the tracker

User Journey

Competitor Analysis
Competitor Analysis with the existing Project Tracker apps available on Market

Information Architecture
The evolving nature of Search Labs presented a unique set of UX hurdles:

Take aways
Wireframes
Initial wireframes created to see how the screens could flow parallely to make sure each user segment has a seemless experience

Initial Designs
Initial Designs were created using the brands design system and colours,

Dashboard
KPI Cards & Graphs: Added visual indicators displaying the number of completed projects and an average process overview etc, helping users track progress efficiently.
Personalized Dashboard: Included user greetings and names to create a more engaging and interactive experience.
Progress Indicators: Added a progress bar on the project list, we can add touchpoints that display progress percentages when hovered over.
Decluttered Action Points: Action buttons will now appear only on hover, reducing cognitive overload and making the interface cleaner and more intuitive.
Remarks
The Graph turned out to be highly complex with numerous projects and each projects having subdivisions
The colours on KPI cards were too distracting
Table rows height was high creating a longer table and wastage of space
Profile picture option was removed as not everyone was comfortable sharing their pictures

Daily Log
Daily log flow created to add daily logs at ease
A table and filters that can be applied to view the logs and also to add daily logs
Action buttons will now appear only on hover, reducing cognitive overload and making the interface cleaner and more intuitive.
Remarks
Lack of visual Heighrachy in the screen can cause confusion to the users on where to click
The colour in the background is distracting and too bright to the users
Buttons are huge and chunky can overwhelm the users
Table rows height was high creating a longer table and wastage of space
Final Design
Final Designs were created to be much lighter and cleaner on the eye as well as to create a smooth and direct experience


Dashboard Design
KPI Cards & Graphs: Removed distinct card shapes and created a seamless design, removed the graph as per feedback as it turned out to be highly complicated and confusing for the users
Personalized Dashboard: Included user greetings and names to create a more engaging and interactive experience, removed the profile picture.
Progress Indicators: Added a clear progress indicator with higher color contrast and percentage value.
Decluttered Action Points: Changed the colour from grey to blue as grey could indicate inactive state

Task List
Project name Cards & Graphs: Added project name and KPIs as header card for ease of reference and transparency for the user
Editable Table: Editable table with an added horizontal scroll to create breathing space add not have a congested table that creates confusion and cognitive overload
Decluttered Action Points: Rows of the table are highlighted on hover with clear fields to indicate its editable


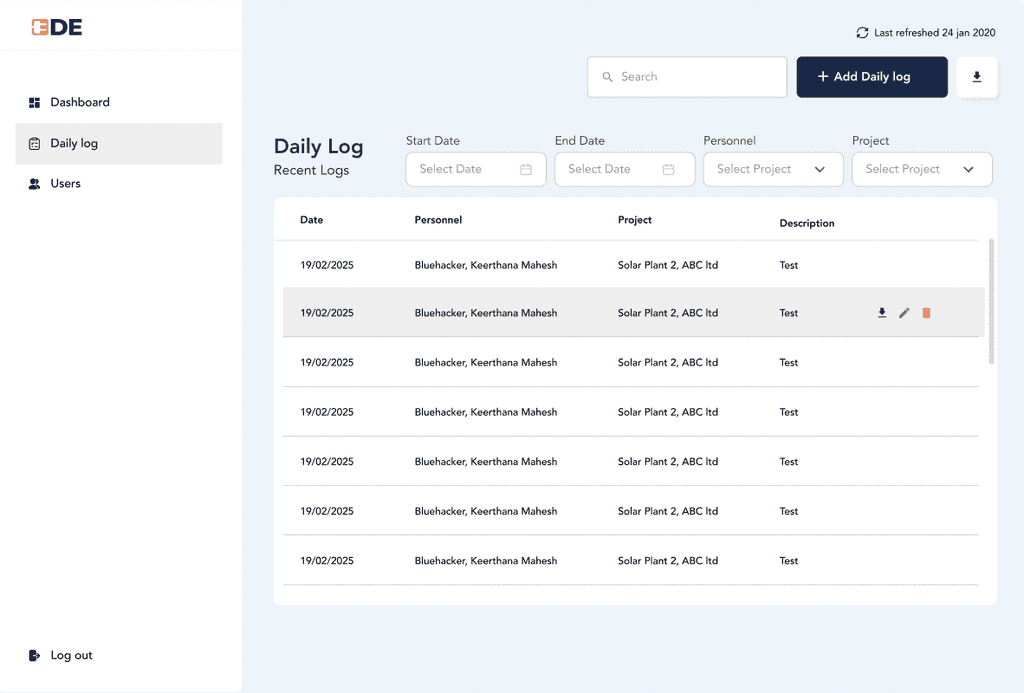
Daily log flow
Clear and Organized Log Display:
The logs are presented in a structured table format with columns for date, personnel, project, and description.
Pagination ensures that large datasets remain scroll-friendly and don’t overwhelm the user.
Search Bar & Filters:
A search bar and filters help users quickly find relevant logs without scrolling.
Side Pop-Up Form:
The pop-up allows users to log entries without leaving the main page, maintaining context.
Dropdowns for personnel and projects reduce manual errors and speed up data entry.
The file upload option enables users to attach supporting documents without cluttering the UI.
Strong Call-to-Action (CTA) & Accessibility:
The "+ Add Daily Log" button is prominently placed, encouraging users to add new entries.
